Thank you for choosing GraphEbra! This user guide is designed to help you make the most of our web application by providing detailed instructions on its features and functionalities. Whether you're new to GraphEbra or looking to explore its advanced capabilities, you'll find everything you need to know right here.
1. First steps
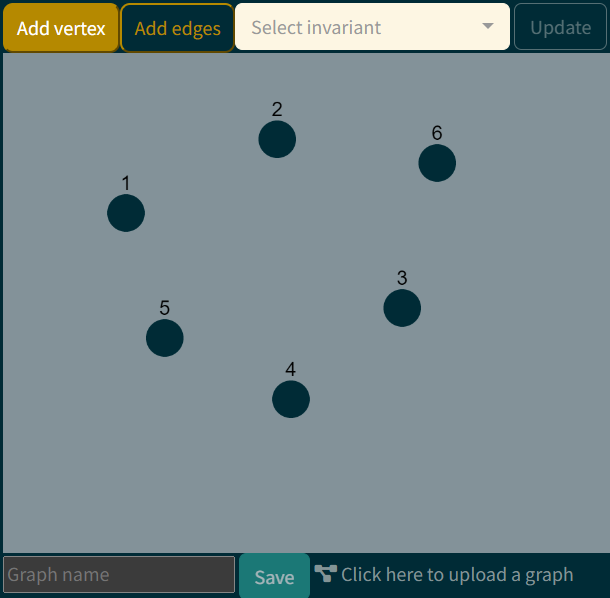
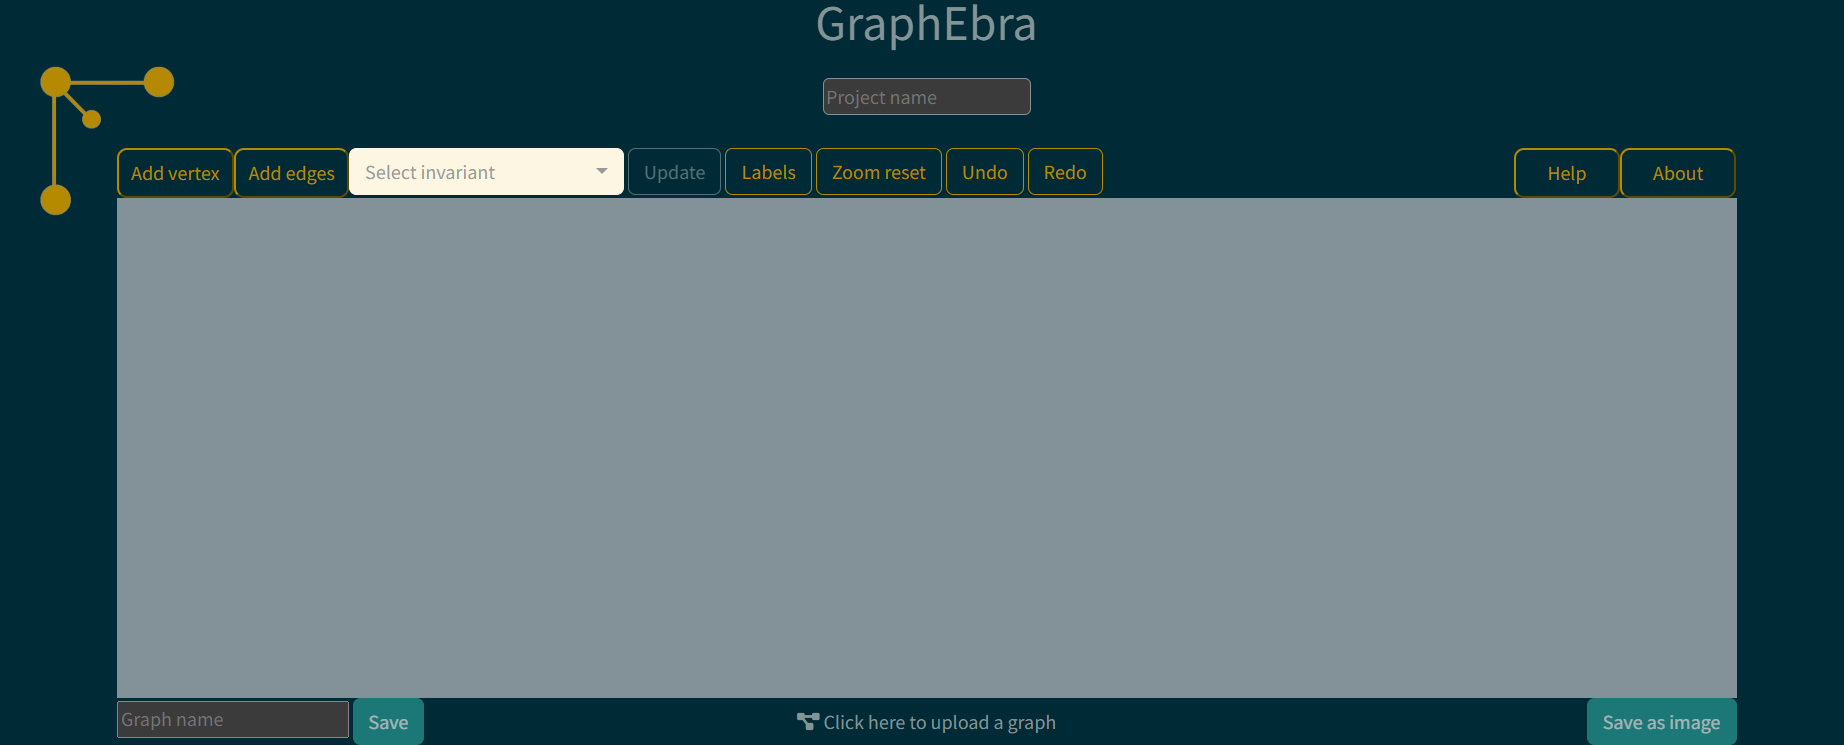
What the interface looks like is presented here. At the top of the page, a space (with a placeholder "Project name") is provided for naming a project. A notable feature is that the project name becomes the tab name, allowing multiple projects to be open simultaneously without them getting mixed up. The main part of the page is dedicated to a canvas where a new graph can be drawn. Above the canvas, various buttons are positioned for actions such as adding vertices, adding edges, adding/removing vertex labels, undoing, redoing, zooming in/out, and more.
2. Drawing a graph
Adding vertices: Press the button "Add vertex" and click somewhere on the canvas.
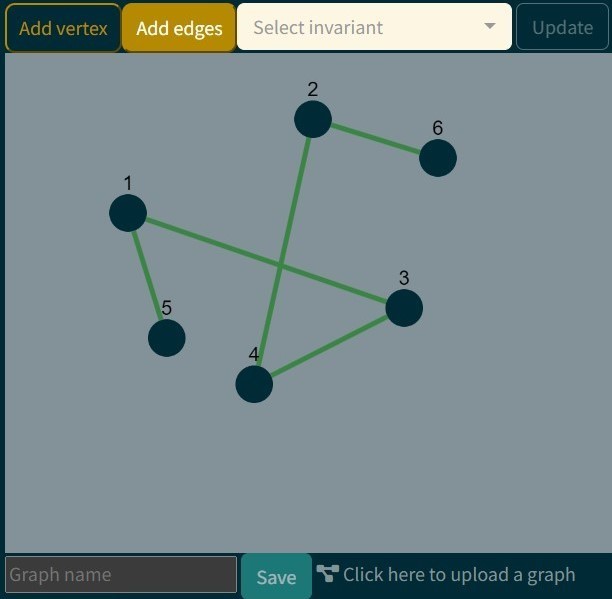
Adding edges: Press the button "Add edge" and an edge is made by clicking on two nodes.
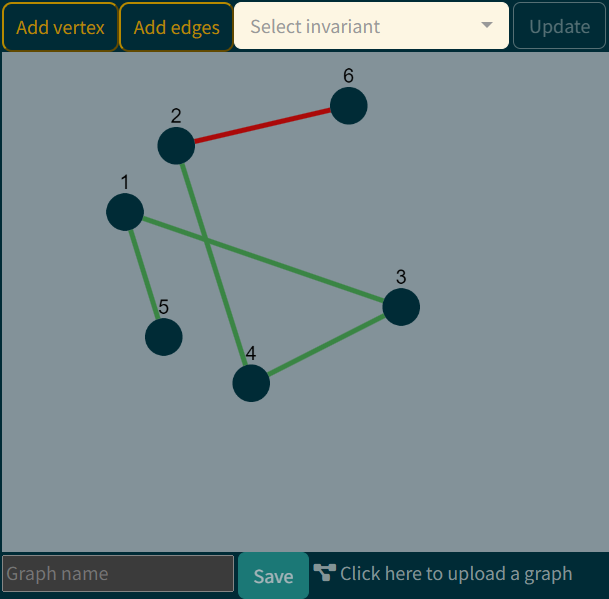
Sign: All edges default to a positive sign, indicated by the green color.
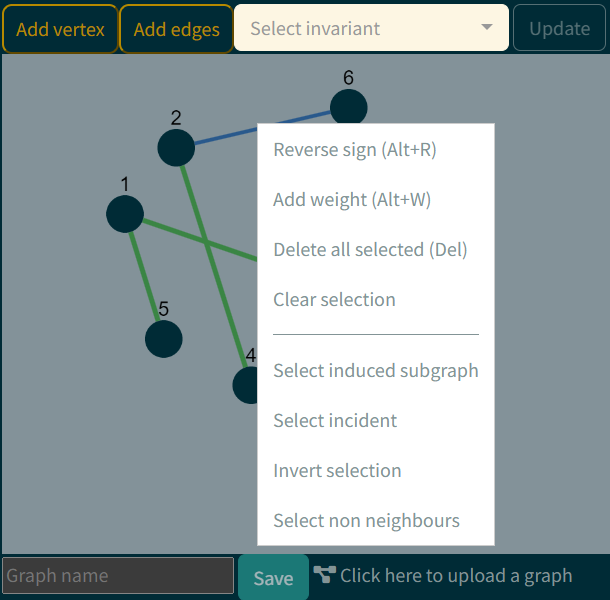
Reverse sign: Right-click on the selected edge and choose "Reverse sign" from dropdown menu. Negative sign is indicated by red color.
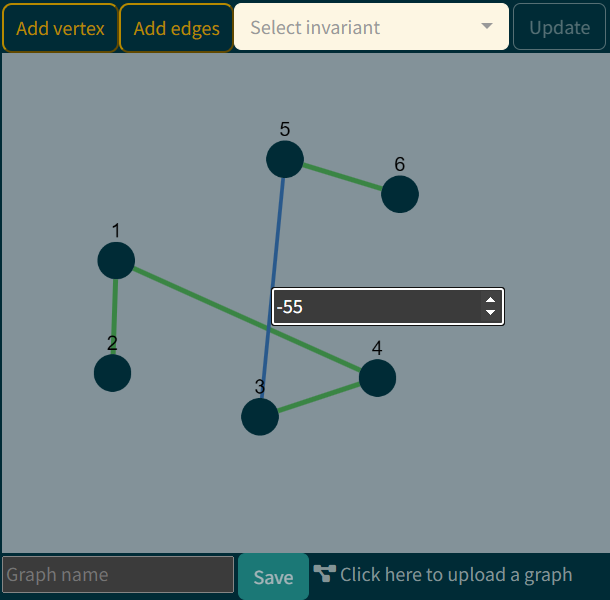
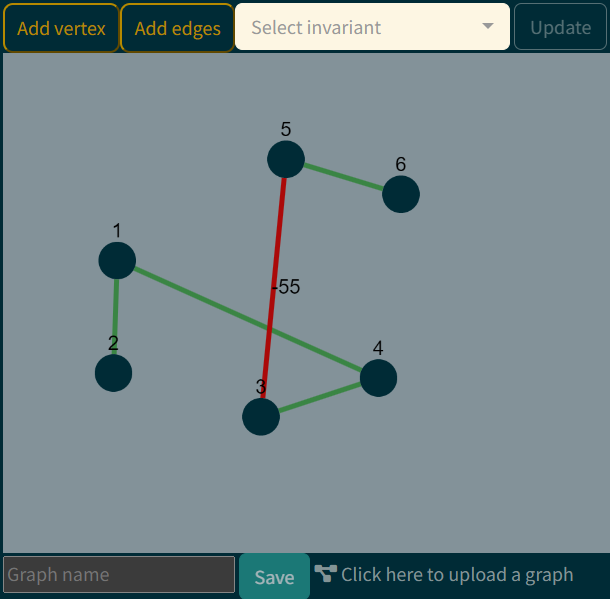
Adding weight: Right-click on the selected edge and choose Add weight from dropdown menu. This action will prompt a box to appear, allowing you to input the desired weight, whether positive or negative. This process enables the alteration of the edge's sign.
3. Exporting and importing a graph
Located just below the canvas is an input box where you can specify a name for your graph. Upon clicking the "Save" button, the created graph will be downloaded in the JSON format. To import a new graph, simply click on "Click here to upload a graph" and select the relevant .txt file that represents the graph in the previously mentioned JSON format. In the image below, you can observe a graph along with its corresponding JSON representation for import/export.

4. Invariants
One of the primary functionalities is the automatic computation of graph invariants. Right now there is a list with approximately 40 invariants, allowing users to search for the specific invariant they want to calculate for the entered graph. Additionally, multiple invariants can be added simultaneously. Upon selecting the "Update" button, the subset of chosen invariants, along with their corresponding values, will be presented in a section below the graph. Importantly, these invariants are calculated in real-time, ensuring that any modifications made to the graph dynamically update the values of all invariants. This feature provides users with a continuous overview of the graph's properties. Users have the flexibility to rearrange and reposition these invariants according to their preferences. Furthermore, a convenient "Copy" button facilitates the duplication of both the name and current value of the selected invariant into the system's memory.

5. Other functionalities
Select: To select a single object (vertex or edge), simply click on the desired item. While selecting, ensure that the "Add vertices" and "Add edges" buttons are turned off. To select multiple objects, hold down the control key and drag to create a selection rectangle.
Dropdown menu: Once you've selected a group of objects, you can perform operations like making it complete, selecting the incident subgraph, or making it empty. The dropdown menu that appears depends on where you click: the canvas, a selected edge, or a selected node.
Lables: The "Labels" button allows you to add or remove labels from vertices.
Reset zoom: You can zoom in or out using the mouse scroll wheel. Additionally, there is a "Reset zoom" button to return the graph to its default size.
Undo/Redo: There are "Undo" and "Redo" buttons to reverse or redo action.
Save as image: Below the canvas, there's a "Save as image" button that captures a snapshot of the current graph and downloads it as a PNG file.